All Blogs

If an attacker could choose to control just one part of your digital infrastructure, they would pick your APIs. These interfaces have become the structural backbone of modern business. However, they are also the most effective entry point for cybercriminals.
Recent market data shows that the global API security sector is surging toward a 12.2 billion dollar valuation by 2034. Yet, technical innovation is currently moving much faster than defensive maturity. Organizations are no longer just fighting simple bots but sophisticated campaigns that mimic legitimate human behavior with high precision.
- API attack volume has surged by 113% year over year, leaving the average company to face 258 attacks every day.
- A massive 99% of enterprises reported encountering significant API security issues within the last year.
- Perimeter defenses are proving insufficient as 95% of successful API attacks now occur within authenticated sessions.
- Shadow AI integrations are increasing financial risk, with related breaches costing an average of 4.63 million dollars.
These statistics highlight a universal problem that requires immediate action. This report breaks down the essential 2026 data points you need to know. We examine the rise of agentic AI vulnerabilities and the true cost of unmanaged endpoints to help you protect your data in this high-speed environment.
99% of organizations face API issues. Do not wait until your web application is breached. Try for $0
ON THIS PAGE
- The Global API Security Market Size (2024-2034)
- Key API Security Statistics Overview (2026)
- Where API Vulnerabilities Actually Come From
- Frequency of API Security Incidents
- Common API Vulnerabilities Exploited Stats
- Industry-Wise API Security Statistics
- Agentic AI and MCP Vulnerabilities: The New Frontier
- Cost of API Security Breaches (2026)
- API Breaches by Country and Third-Party Risk Contribution
- API Security Compliance & Regulatory Stats
- Wrapping Up
The Global API Security Market Size (2024-2034)
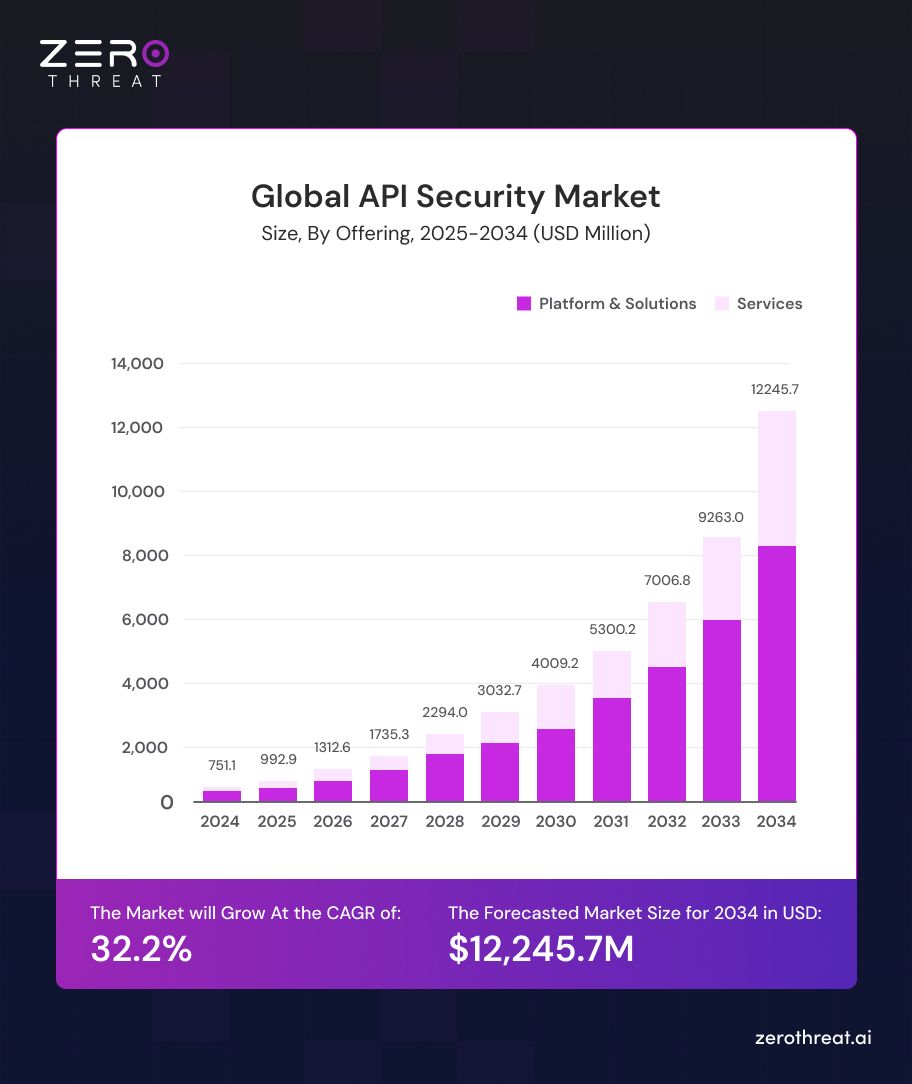
The global API security market is expanding rapidly, driven by rising cyber threats and increasing API adoption. The market is projected to grow from USD 751.05 million in 2024 to USD 12,245.7 million by 2034, at a strong CAGR of 32.2%.
North America leads the market with over 42% share, generating around USD 315.4 million in revenue. This dominance is driven by strong cybersecurity investments, cloud adoption, and increasing demand for advanced API protection solutions across industries.
Key API Security Statistics Overview (2026)
Recent data indicates that the average organization now faces 258 API attacks every day. This represents a 113% increase compared to the previous year. Security experts note that 61% of these incidents involve unauthorized workflows or behavioral abuse. Attackers are moving away from simple automated scripts and are instead mimicking legitimate user patterns to bypass standard defenses.
Core API Security Statistics: Quick Snapshot
- 99% of organizations experienced API security issues in the past year
- 57% of organizations faced at least one API-related data breach over the last two years
- Over 90% of web-based attacks now target APIs
- 32% of organizations reported API security incidents in a single year
- 95% of API attacks originate from authenticated sessions, not anonymous traffic
- On average, 2,200 cyberattacks target API endpoints globally every single day
API Breach Reality
- 57% of organizations suffered an API-related data breach in the past two years. Of those, 73% experienced three or more separate incidents. That is not a one-time exposure. That is a pattern.
- 41% of organizations endured five or more API breaches, pointing to a clear gap between awareness and action. Companies know APIs are a risk. Many just haven't fixed the underlying problem yet.
- API-related incidents affected 84% of security professionals in the past 12 months. Nearly everyone in the industry has felt the impact directly.
Detection and Defense Gaps
- Only 21% of organizations report a high ability to detect attacks at the API layer. Only 13% can prevent more than 50% of API attacks.
- Almost 38% of organizations discovered API breaches only after external reporting, not through internal detection, but after someone else told them they had a problem.
- Just 14% of organizations currently have an API posture governance strategy in place. Without a governance framework, managing API risk at scale becomes almost impossible.
Attack Volume and Speed
- API attack traffic has surged by over 600% in recent years, reflecting rapid growth in attack volume. Attackers begin scanning for new vulnerabilities within 15 minutes of disclosure.
- AI-driven attacks now accelerate exploitation timelines to as little as 1.2 hours in some cases. By the time most security teams are aware of a new vulnerability, active exploitation may already be underway.
The AI Factor
- The Model Context Protocol (MCP) alone accounted for 315 vulnerabilities as of 2025, representing 14.4% of all AI vulnerabilities. From Q2 to Q3 of 2025, MCP vulnerabilities increased by 270%.
- 51% of developers now cite unauthorized API calls from AI agents as their top security concern. 49% worry about AI systems accessing sensitive API data without proper controls.
- Organizations that used AI and automation extensively reduced their breach detection timelines by 80 days and saved an average of $1.9 million per incident.
Where API Vulnerabilities Actually Come From
An analysis of 60 API-related breaches disclosed in 2025 shows that broken authentication was the culprit in 52% of incidents, while unsafe consumption of APIs accounted for 27%.
88% of API attack attempts leverage one or more of the OWASP API Security Top 10 vulnerabilities. These are known, documented weaknesses. Yet only about 67% of organizations actively focus on the OWASP API list as part of their defense strategy.
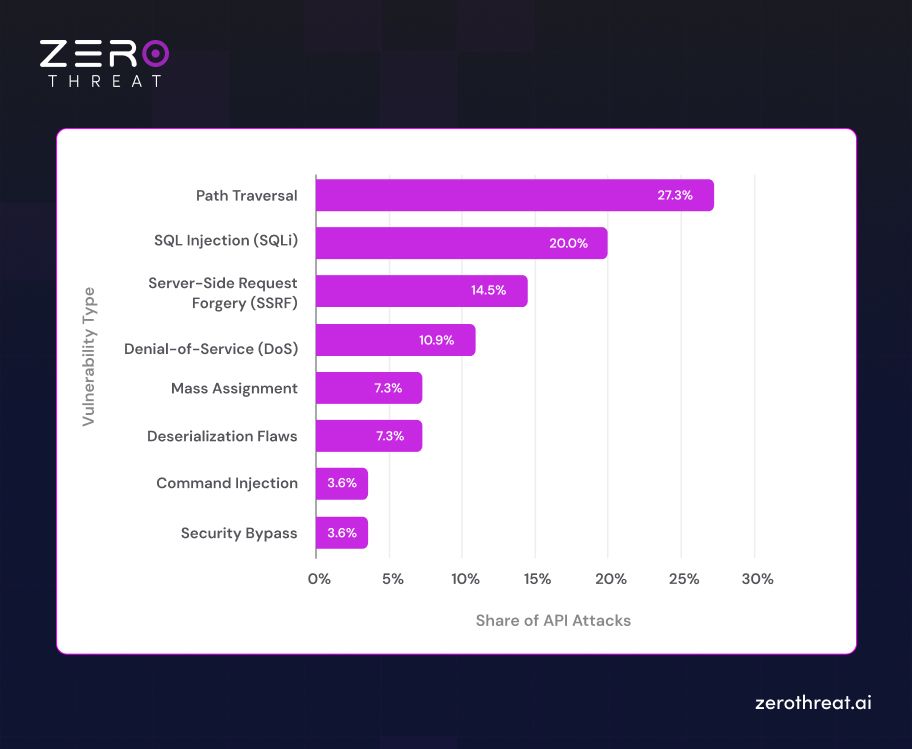
Path Traversal accounts for 27.3% of common API vulnerabilities. SQL Injection follows at 20%. Server-Side Request Forgery (SSRF) represents 14.5%.
Why API Visibility Remains the Core Problem
You cannot secure what you cannot see. 56% of enterprises admit they lack full visibility into their API data flows. Shadow APIs, zombie endpoints, and undocumented third-party integrations all contribute to an attack surface that most organizations have no complete picture of.
In the U.S., 1 in 3 organizations reported customer data exposure linked to APIs in 2025. According to reports, 65% of organizations state that generative AI applications pose a serious to extreme risk to their APIs. Plus, 60% say that AI integrations are actively expanding their organization's attack surface.
One unsecured API can expose millions of records. Test every endpoint with ZeroThreat.Pentest My APIs
Frequency of API Security Incidents
API security incidents are visible in the daily volume of threats, as 2,200 cyberattacks now target API endpoints worldwide every single day. Because these interfaces are so critical to modern business, they have become a primary target for automated and manual exploitation.
Here are some of the key stats that might blow your mind:
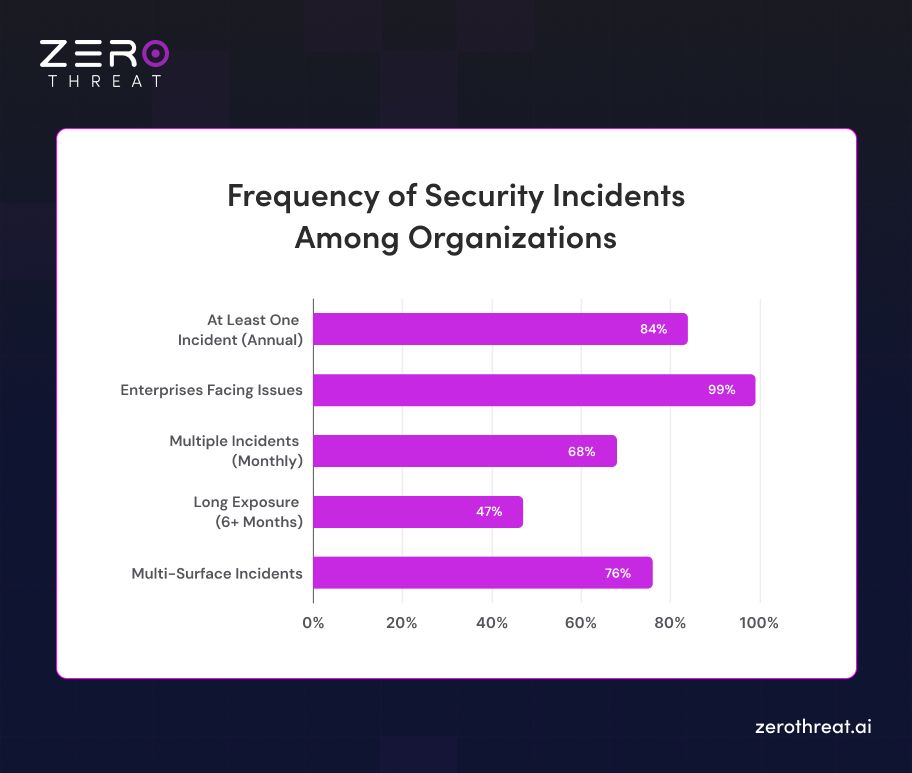
- Approximately 84% of companies face at least one major API incident annually.
- About 68% of organizations now experience multiple API security incidents every single month.
- Individual organizations frequently report facing tens of thousands of API attacks on a monthly basis.
- The detection gap remains high, as 47% of API endpoints stay exposed for six months or more before they are discovered.
- Security researchers identified 239 new API vulnerabilities in just a single quarter.
- Roughly 76% of all API incidents involve multiple attack surfaces, which significantly complicates the containment process.
Common API Vulnerabilities Exploited Stats
API breaches rarely happen through unknown attack methods. Most stem from a short list of well-documented weaknesses that keep getting overlooked. Research shows that the top vulnerability categories alone account for the vast majority of real-world API incidents.
These specific vulnerabilities define the current threat landscape:
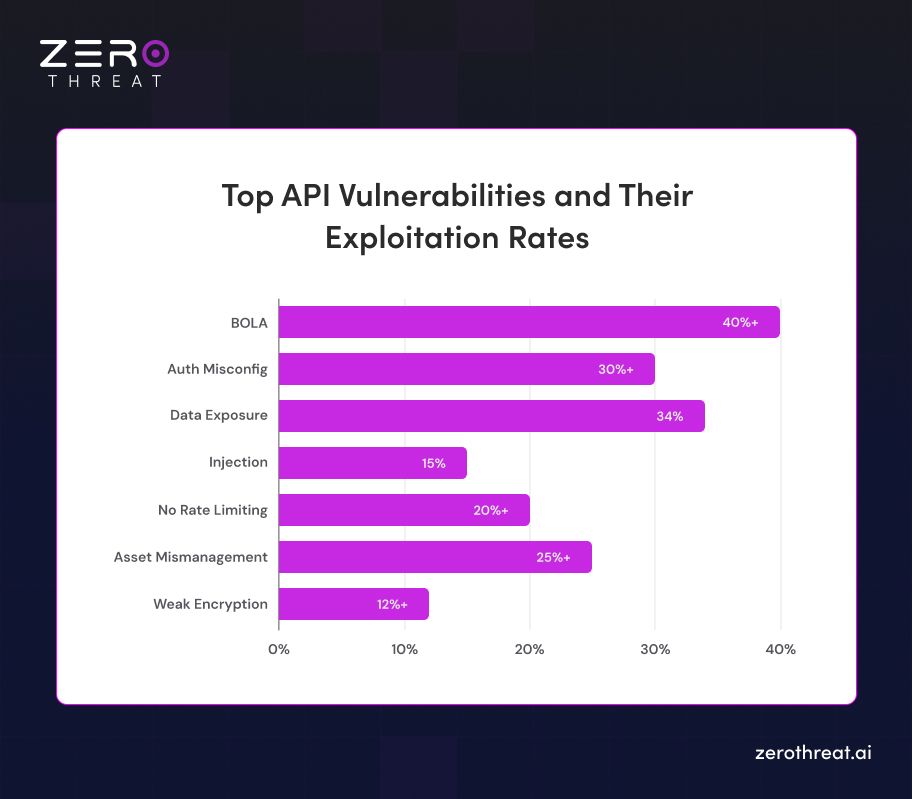
- Broken Object-Level Authorization (BOLA): This is the most frequent issue, appearing in over 40% of cases. Attackers exploit it to access or modify data belonging to other users by manipulating object identifiers.
- Authentication Failures: Weak authentication setups drive 30% of total breaches. These gaps make it easy for unauthorized actors to gain entry using stolen or guessed credentials.
- Excessive Data Exposure: Roughly 34% of incidents involve APIs that share too much information. This usually happens when developers rely on client-side filtering rather than strict server-side controls.
- Injection and Brute-Force: Injection attacks still account for 15% of vulnerabilities. Additionally, a lack of rate limiting allows for successful brute-force attacks in 20% of API abuse cases.
- Asset Management Gaps: Nearly 25% of breaches involve older, forgotten endpoints that lack modern security patches. These "zombie" APIs provide an easy entry point for persistent threat actors.
Industry-Wise API Security Statistics
Financial services report over $4 billion in annual API-related fraud losses, while SaaS companies see APIs involved in 70% of security incidents, showing how risk varies across industries.
| Industry | Impact |
|---|---|
| Financial Services | Annual fraud losses from API exploits now exceed $4 billion. |
| Healthcare | API breaches increased by 25% year over year during digital shifts. |
| SaaS | Vulnerabilities are linked to 70% of all security incidents. |
| Retail & E-commerce | API abuse contributes to more than 20% of total fraud cases. |
| Telecommunications | Repeated breaches occur annually and affect millions of customers. |
| Public Sector | Attacks on citizen data through APIs rose by 30% in 2025. |
| Fintech Startups | Nearly 50% of security incidents involve API-related threats. |
| Manufacturing & IoT | Connected device expansion drives a yearly 18% rise in API risks. |
| Media & Social Platforms | Large datasets and open APIs maintain their status as high-value targets. |
Every sector faces unique challenges as they integrate more connected services into their daily operations. While financial institutions deal with direct monetary theft, healthcare and public sector groups must prioritize the protection of sensitive citizen and patient records. These statistics prove that a one-size-fits-all security strategy is no longer effective for modern enterprises.
Agentic AI and MCP Vulnerabilities: The New Frontier
The rise of agentic AI has introduced a complex new layer to the modern API attack surface. Cybersecurity professionals now identify autonomous systems as the most dangerous attack vector for 2026. This concern stems from the fact that AI agents rely almost entirely on APIs to interact with data and execute autonomous tasks.
A significant risk factor is the Model Context Protocol (MCP), which serves as the standard for connecting agents to tools. Recent audits show that 43% of public MCP servers are vulnerable to command execution. These flaws allow attackers to pass malicious input through an agent and run unauthorized code on the server. Furthermore, researchers found that 36% of all AI vulnerabilities are directly related to API security issues.
| Key Agentic AI & MCP Statistic | 2026 Benchmark Data |
|---|---|
| Security pros naming Agentic AI as the top threat | 48% |
| MCP servers vulnerable to command injection | 43% |
| Malicious skills in the OpenClaw marketplace | 12% |
| Growth of MCP vulnerabilities (Q2 to Q3 2025) | 270% |
One API breach costs $5 million. Invest in affordable protection that scales with you needs. Check Out Pricing
Cost of API Security Breaches (2026)
API breaches are not just security incidents. They are high-impact business events. The global average cost of a data breach reached $4.44 million, and API-related incidents often exceed this baseline. Organizations with heavy API usage report breach costs crossing $5 million per incident, driven by wider data exposure and complex attack paths.
Financial Impact of API Security Breaches
| Cost Factor | Statistic | Business Impact |
|---|---|---|
| Average Breach Cost | $4.44 million | Baseline financial damage |
| API Breach Premium | Up to 20% higher | Increased exposure and complexity |
| High API Usage Enterprises | $5M+ per breach | Larger attack surface impact |
| Lost Business | 40%+ of total cost | Customer churn and downtime |
| Detection Delay Impact | 30% cost increase | Longer attacker dwell time |
| Downtime Loss | $300,000 per hour | Revenue disruption at scale |
| Ransomware Impact | 25% higher payouts | API exploitation increases leverage |
| Security Investment Savings | $1.76M saved | Strong API security reduces losses |
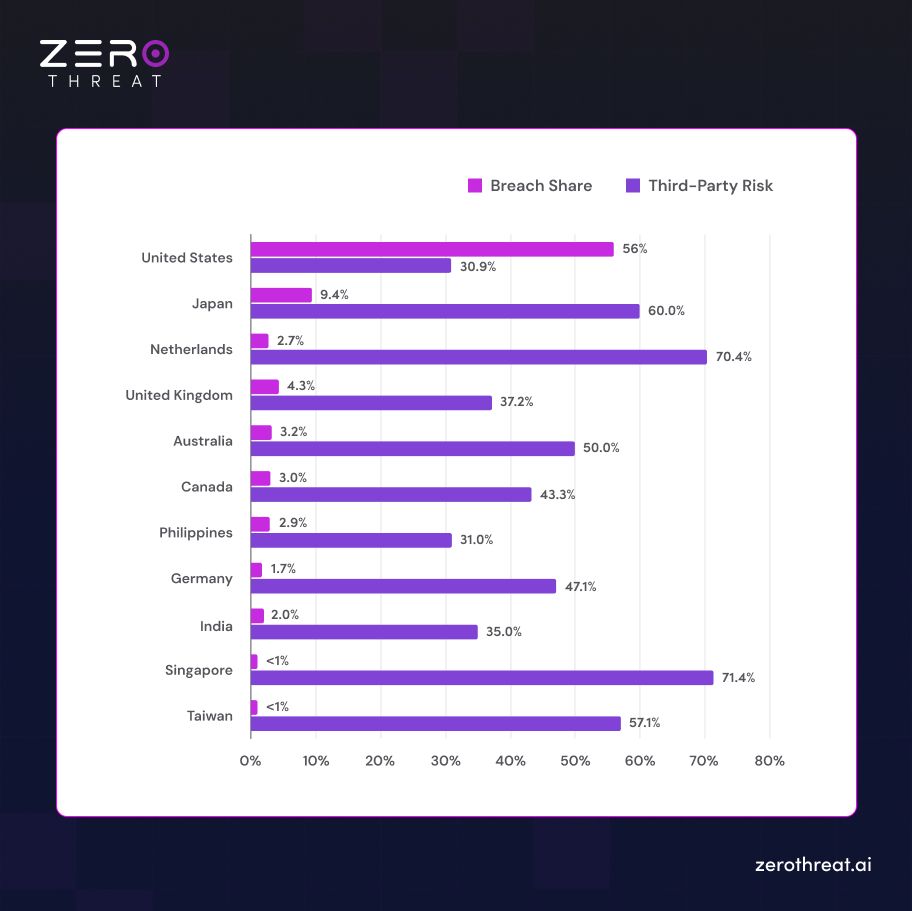
API Breaches by Country and Third-Party Risk Contribution
The United States accounts for 56% of all API breaches, making it the top target worldwide. While breach volume is high, its 30.9% third-party risk rate suggests more mature internal controls.
- North America: The U.S. and Canada show varied profiles. Canada faces a 43.3% third-party risk rate, which is significantly higher than its southern neighbor.
- Asia-Pacific: Japan and Taiwan rely heavily on external vendors. Japan’s third-party breach rate is 60.0%, while Taiwan reaches 57.1% despite a low total breach share.
- Europe: The Netherlands and Singapore report the highest third-party vulnerabilities globally. Singapore leads with a 71.4% third-party rate, and the Netherlands follows closely at 70.4%.
On the other hand, countries like the Philippines and India show lower third-party rates of 31.0% and 35.0%. This indicates that more of their security incidents originate from internal API mismanagement.
Here is the simplified table for understanding where the data is actually pointing to:
API Security Compliance & Regulatory Stats
In 2026, failing to meet these standards leads to more than just a fine. It often results in a total loss of consumer trust and immediate operational restrictions. The following data highlights the current state of regulatory pressure and the cost of failing to secure your API endpoints.
GDPR and API Data Exposure Liability
The General Data Protection Regulation remains the strictest privacy framework in the world. By early 2026, cumulative GDPR fines reached a staggering €7.1 billion. Regulators are increasingly focusing on "Insufficient Legal Basis" for data processing, which often happens when APIs over-share information without explicit user consent.
- €1.2 Billion in Annual Fines: This was the total amount of penalties issued in 2025 alone, proving that enforcement is not slowing down.
- 443 Daily Notifications: European authorities now receive an average of 443 breach notifications every single day, a 22% increase from the previous year.
- Compliance Gap: Despite the high risks, only 58% of organizations are currently fully GDPR compliant.
- Price of Non-Compliance: Companies that fail to meet these standards face an average profit drop of 8% compared to their compliant peers.
HIPAA API Security Considerations
The healthcare sector remains the most targeted industry for API attacks because medical records are ten times more valuable than credit card numbers on the dark web. HIPAA auditors in 2026 are focusing heavily on third-party vendor risks, as these partners are often the weakest link in the data chain.
- $7.42 Million Per Breach: Healthcare has been the most expensive sector for data breaches for 14 years in a row.
- Record Exposure: In 2025, 276 million patient records were compromised, which means roughly four out of every five Americans had their health data exposed.
- Third-Party Surge: Breaches involving a business associate or vendor doubled in a single year, now accounting for 30% of all healthcare incidents.
- Dwell Time: The average healthcare breach takes 213 days to detect and contain, giving attackers months of access to sensitive APIs.
PCI DSS API Requirements
As of March 31, 2025, PCI DSS 4.0 is the mandatory standard for anyone handling credit card data. This version requires a shift toward "continuous security," meaning your API monitoring must be active 24/7 rather than audited once a year.
- Monthly Penalties: Organizations that fail to maintain PCI compliance can face monthly fines ranging from $5,000 to $100,000.
- Low Compliance Rates: Only 14.3% of organizations currently maintain full, ongoing PCI compliance across all their systems.
- E-commerce Target: There were 150 billion API attacks recorded against commerce organizations over a two year period, highlighting the pressure on payment interfaces.
- Credential Attacks: Credential stuffing attacks against financial APIs increased by 45% year over year in 2025.
ISO 27001 API-Related Controls
ISO 27001 remains the gold standard for information security management. Organizations that align their API security with this framework report much lower recovery costs after an incident.
- Financial Advantage: Companies that heavily deploy security automation, a key part of modern ISO alignment, save an average of $2.22 million per breach.
- Adoption Growth: 38% of organizations now spend over $5 million annually on privacy and framework alignment, up from 14% just two years ago.
API Compliance and Regulatory Statistics
| Regulation / Framework | Key Statistical Benchmark | Primary Business Risk |
|---|---|---|
| GDPR | €7.1 Billion in cumulative fines | Fines up to 4% of global revenue |
| HIPAA | $7.42 Million average breach cost | High per-record exploitation value |
| PCI DSS 4.0 | Only 14.3% full compliance rate | Monthly fines up to $100,000 |
| ISO 27001 | $2.22 Million saved via automation | Loss of enterprise-grade contracts |
| LGPD (Brazil) | Fines up to 2% of annual revenue | Immediate suspension of data access |
Not sure where your API security gaps are? Let our team walk you through it. Get in Touch
Wrapping Up
API security statistics in 2026 clearly show that APIs are now the primary attack surface, with most breaches linked to weak authentication, poor visibility, and logic flaws. As adoption grows, so does risk, making API security a business-critical priority.
The data shows that common issues like broken authorization, exposed endpoints, and unmanaged APIs continue to drive incidents. Frequent attacks, rising breach costs, and industry-wide exposure highlight one truth. Traditional security approaches are no longer enough to protect modern API ecosystems.
To reduce risk and control costs, organizations need proactive testing and real-world validation. That’s where ZeroThreat steps in. Its API penetration testing tool helps identify exploitable paths, validate vulnerabilities safely, and strengthen security posture with AI-powered remediation guidance.
Frequently Asked Questions
What are the most common API threats in 2026?
Security misconfigurations and Broken Object-Level Authorization (BOLA) are the leading threats, representing 40% and 35% of exploited vulnerabilities. DDoS attacks and automated bots also account for over 30% of security incidents. These threats increasingly target business logic and trust failures rather than just traditional code bugs.
Which industries have the highest API breach rates?
What’s the difference between API gateway and API security platform?
What do API security statistics say about authentication failures?
How many companies got hacked through APIs last year?
What are the real costs of an enterprise API data breach?
How common is broken authorization in real-world APIs?
What does the latest API security report say about bot attacks?


Explore ZeroThreat
Automate security testing, save time, and avoid the pitfalls of manual work with ZeroThreat.