All Blogs
From CVEs to Zero-Days: Cybersecurity Vulnerability Statistics

Quick Overview: This blog explores the latest cybersecurity vulnerability statistics for 2026, uncovering the surge in CVEs, rapid exploit rates, and AI-powered threats. It highlights key trends, industry-specific risks, and actionable insights to help security teams stay ahead in an increasingly complex and fast-moving threat landscape.
2026 is turning out to be a turning point in the cybersecurity industry. With digital transformation accelerating and artificial intelligence reshaping how we build and break systems, the number and severity of vulnerabilities are surging at an unprecedented pace.
The cybersecurity community is facing not just a numbers game, but a complexity crisis: vulnerabilities like CSRF, SQLi, and XSS are no longer isolated software bugs; they are critical business risks, frequently exploited in minutes rather than months.
This in-depth report delivers a research-backed, data-rich analysis of the most significant vulnerability trends of 2026, from CVE volumes to zero-day exploitations, from AI-driven pentesting to sector-specific threats. Whether you’re a security engineer, a CISO, or a DevSecOps lead, this research - Cybersecurity Vulnerability Statistics in 2026, will help you understand how the threat landscape has shifted, and how to prioritize your next move.
Attackers won’t wait. Scan your apps now and find vulnerabilities before they do. Start Free Scan
On This Page
- The Vulnerability Surge in 2026
- Vulnerability Intelligence Update for 2026
- Cybersecurity Vulnerability Statistics in 2026
- Most Vulnerable Industries in 2026
- Top Vulnerable OSS Libraries
- Top Countries Producing Vulnerable Code
- Important Cyber Security Vulnerabilities Statistics 2026
- Detection and Severity of Vulnerabilities
- Critical Application Security and Threat Exposure Stats
- Final Thoughts: From Awareness to Action
The Vulnerability Surge in 2026
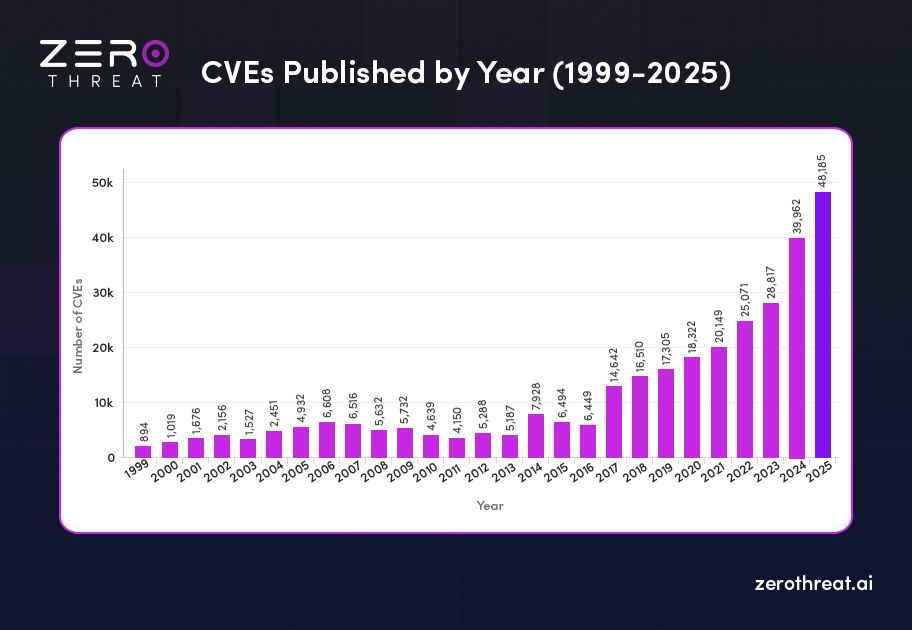
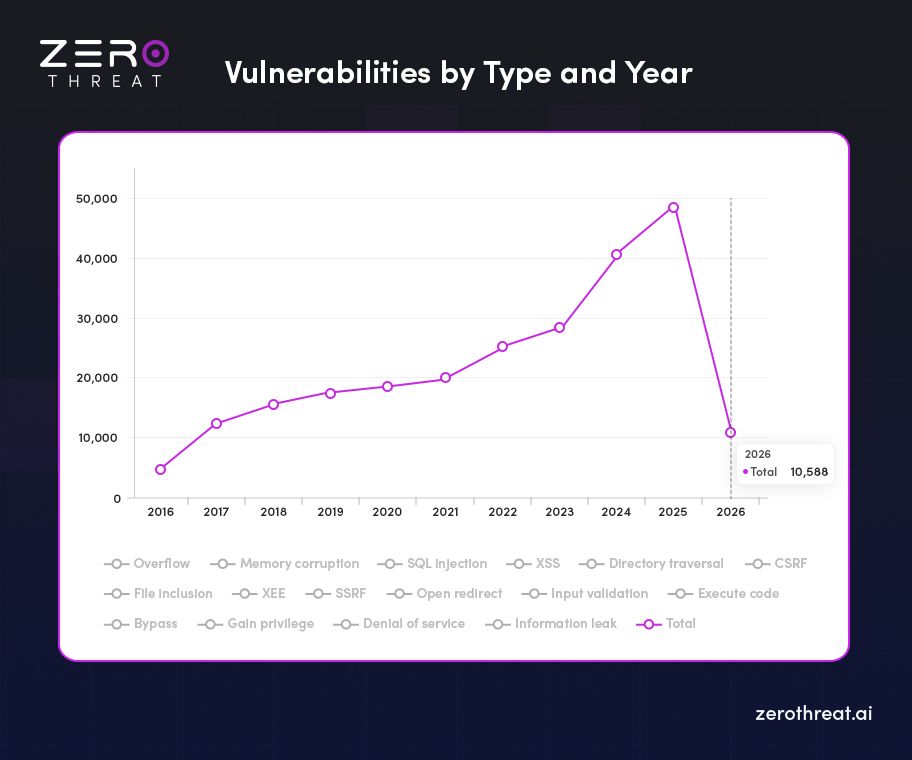
As of early 2026, the vulnerability landscape continues to grow at record speed. In 2025 alone, 48,185 CVEs were published, representing a 20.6% increase compared to 2024’s 39,962 vulnerabilities.
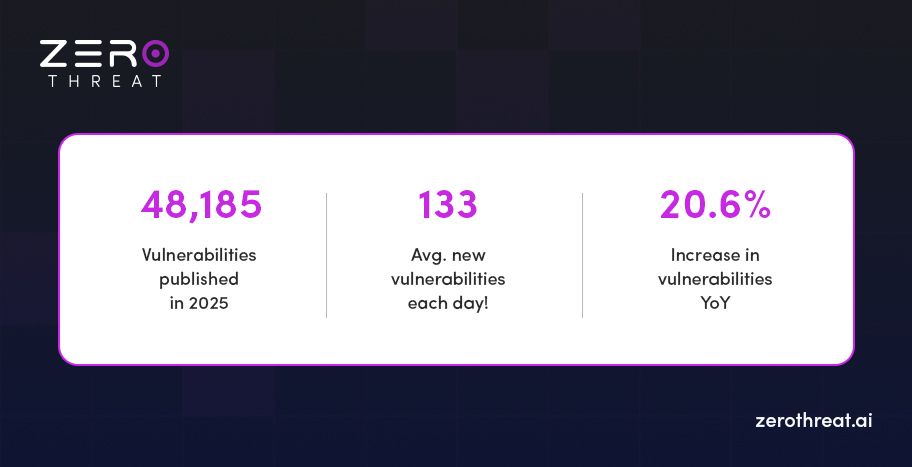
- Average vulnerabilities reported per day: 133
- Year-over-Year increase in total vulnerabilities: +8,223
That’s 133 new vulnerabilities every single day that security teams must detect, assess, and patch—across thousands of devices and applications.
Vulnerability Severity Breakdown
| Severity | Count |
|---|---|
| Critical | 4,519 |
| High | 14,703 |
| Medium | 24,222 |
| Low | 1,354 |
| Unrated | 3,387 |
About 40–42% of disclosed vulnerabilities are classified as High or Critical severity, requiring immediate remediation to prevent exploitation in production environments.
What This Means for Your Organization
With 133 new cybersecurity vulnerabilities surfacing each day in 2025, organizations face relentless pressure to:
- Identify and prioritize critical risks
- Patch systems across complex, distributed IT environments
- Maintain compliance with evolving security standards
Manual tracking simply can’t keep up.
According to recent reports, December saw the highest number of disclosures, with about 5,500 CVEs, over 11% of the year’s total. This makes an unusual spike compared to typically quieter year-end months.
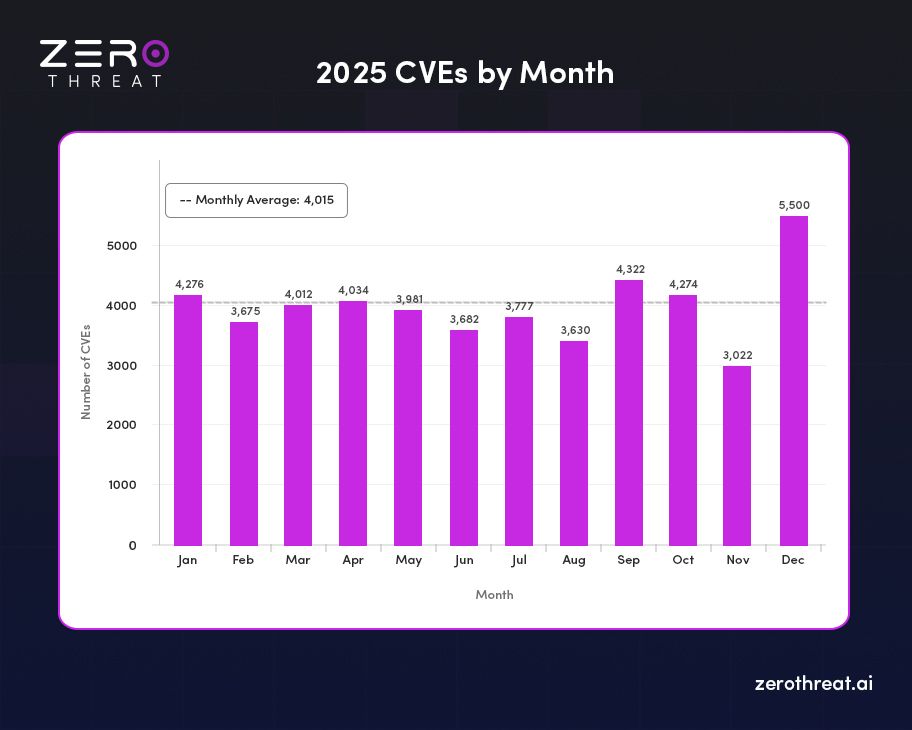
| Month (2025) | Total Vulnerabilities | Critical | High | Medium | Low | Unrated |
|---|---|---|---|---|---|---|
| January | 4,276 | 304 | 1,300 | 2,022 | 80 | 570 |
| February | 3,677 | 270 | 1,087 | 1,791 | 119 | 410 |
| March | 4,015 | 403 | 1,331 | 1,966 | 111 | 204 |
| April | 4,036 | 341 | 1,355 | 1,886 | 121 | 333 |
| May | 3,984 | 366 | 1,013 | 1,987 | 117 | 501 |
| June | 3,920 | 352 | 1,102 | 1,918 | 104 | 444 |
| July | 3,960 | 368 | 1,145 | 1,912 | 109 | 426 |
| August | 4,105 | 395 | 1,180 | 1,980 | 112 | 438 |
| September | 4,170 | 402 | 1,210 | 2,005 | 115 | 438 |
| October | 4,120 | 388 | 1,195 | 1,985 | 110 | 442 |
| November | 4,422 | 410 | 1,245 | 2,130 | 116 | 521 |
| December | 5,500 | 520 | 1,540 | 2,640 | 140 | 660 |
This spike underscores the urgent need for advanced AI-powered automated pentesting, vulnerability assessment, and monitoring to stay ahead of the evolving threat landscape.
Vulnerability Intelligence Update for 2026
Staying ahead of the threat curve requires real-time awareness of CVEs (Common Vulnerabilities and Exposures) and how they’re evolving. Here’s a snapshot of the most recent data from global CVE vulnerability databases:
CVE Activity Overview
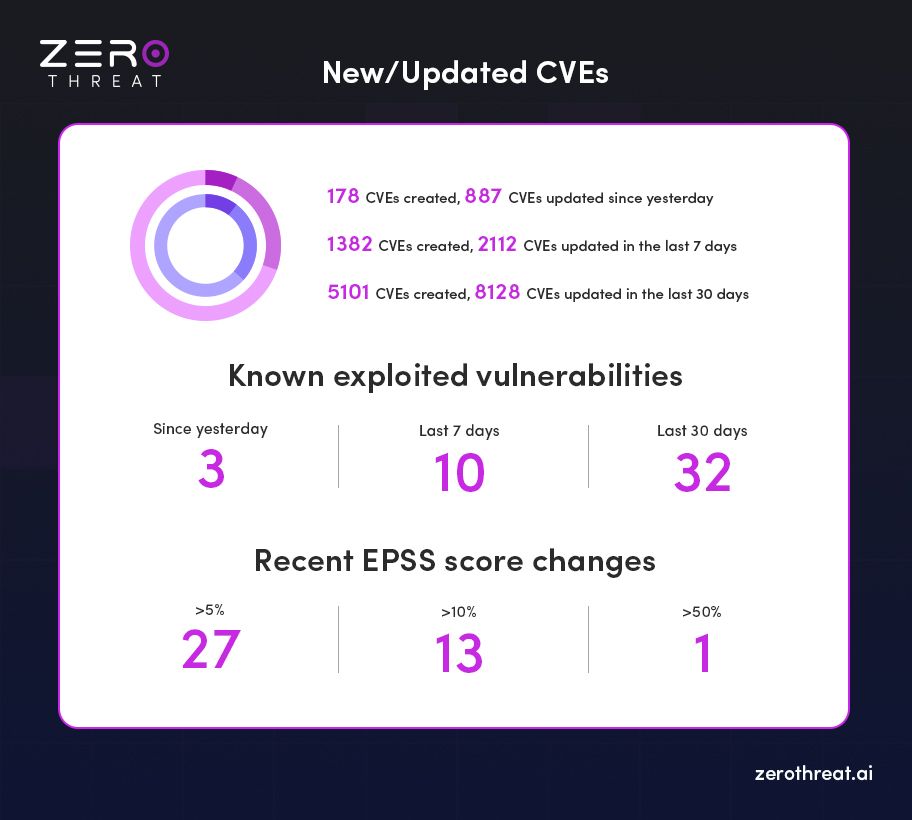
- In the Last 24 Hours:
- 178 new CVEs created
- 887 existing CVEs updated
- In the Last 7 Days:
- 1,382 new CVEs created
- 2,112 CVEs updated
- In the Last 30 Days:
- 5,101 new CVEs created
- 8,128 CVEs updated
Insight: With over 5,000 new vulnerabilities in just a month, threat actors are gaining a wider attack surface—forcing security teams to scale detection, prioritization, and remediation rapidly.
Known Exploited Vulnerabilities
The U.S. Cybersecurity and Infrastructure Security Agency (CISA) and other global feeds have confirmed:
- Exploited in the Last 24 Hours: 3 CVEs
- Exploited in the Last 7 Days: 9 CVEs
- Exploited in the Last 30 Days: 34 CVEs
EPSS (Exploit Prediction Scoring System) Updates
The Exploit Prediction Scoring System (EPSS) helps predict the likelihood a CVE will be exploited in the wild. Over the past day:
- 43 CVEs saw a >5% increase in EPSS score
- 15 CVEs jumped by more than 10%
- 0 CVEs showed a >50% score spike
Experience Advanced DAST Scanning with Zero Setup and Secure Your Apps Start Scanning Now
Cybersecurity Vulnerability Statistics in 2026: Key Takeaway
Year 2026 experiences a wave of critical vulnerabilities, starting with a major flaw in Chromium-based browsers. From Follina to Log4Shell, several high-impact vulnerabilities kept security teams and business leaders on high alert.
Microsoft SharePoint – RCE via Deserialization (CVE-2024-38094)
A serious deserialization flaw in Microsoft SharePoint allows attackers to perform remote code execution (RCE). Actively exploited and listed in CISA’s Known Exploited Vulnerabilities (KEV) catalog, it underscores the pressing need for immediate patching and risk mitigation.
Impact: Threat actors can remotely execute malicious commands, potentially compromising internal systems and sensitive data within enterprise environments.
Grafana – SQL Expression Injection (CVE-2024-9264)
Over 100,000 Grafana instances, including nearly 19,000 in the U.S., are vulnerable. Exploiting SQL expressions, attackers can execute commands and access restricted files—even with just Viewer permissions.
Impact: Exploitable in critical systems relying on CUPS, especially across Red Hat, Debian, and other Unix-based servers, risking full system compromise.
CUPS – Remote Code Execution Vulnerabilities (CVE-2024-47176, CVE-2024-47076)
Multiple vulnerabilities in the Common Unix Printing System expose over 300,000 devices globally to RCE attacks. Affects major Linux distributions including Debian, Red Hat, and macOS, highlighting a wide threat surface in Unix-based environments.
Impact: Exploitable in critical systems relying on CUPS, especially across Red Hat, Debian, and other Unix-based servers, risking full system compromise.
Ivanti Cloud Services Appliance – OS Command Injection (CVE-2024-8190)
Discovered in September 2024, this flaw enables attackers with admin access to execute remote commands. Affected versions (CSA 4.6 Patch 518 or earlier) must be patched urgently to prevent privilege misuse.
Impact: High-risk for enterprises using Ivanti for remote infrastructure; attackers can seize full control with elevated privileges.
Apache OFBiz – Pre-Authentication RCE (CVE-2024-38856)
This pre-auth vulnerability allows unauthenticated attackers to run arbitrary code in Apache OFBiz. It continues to be a high-value target, reinforcing the importance of version upgrades and secure defaults.
Impact: Can lead to full server takeover; exploited in the wild due to its ease of execution on outdated OFBiz deployments.
OAuth Implementation Flaw – Leading to Widespread XSS
A misconfigured OAuth implementation affects millions of websites, exposing them to cross-site scripting (XSS) attacks. The issue underlines the need for strict validation and hardened auth logic in web applications.
Impact: Identity theft, unauthorized data access, and risk of full account compromise for websites lacking input validation.
ServiceNow – Critical Exploits (CVE-2024-4879, CVE-2024-5217)
Exploited flaws in ServiceNow’s ITSM platform led to breaches of over 105 databases. With CVSS scores of 9.3 and 9.2, the data was sold on dark web forums for up to $5,000 per set.
Impact: Exposed customer records were reportedly sold for $5,000 per database on dark web forums, endangering enterprise integrity.
Apache OFBiz – Authentication Bypass (CVE-2023-51467)
This vulnerability persisted despite a previous patch (CVE-2023-49070), allowing attackers to bypass authentication. It highlights the risks of incomplete fixes and the need for root-cause resolution.
Impact: Demonstrates the risk of incomplete fixes; allows adversaries unauthorized access to enterprise resource planning systems.
LiteSpeed Cache (WordPress Plug-in) – Critical XSS Flaw
Disclosed in July 2024, this vulnerability affects over 6 million WordPress installations. It allows unauthenticated attackers to inject code, escalate privileges, and steal sensitive data with a single HTTP request.
Impact: Enables site takeover, data theft, and malicious payload injection into popular WordPress-powered websites.
GOAnywhere MFT – Admin Creation Exploit (CVE-2024-0204)
A critical flaw in Fortra’s MFT platform enabled attackers to create admin accounts and gain full control of systems. Versions prior to 7.4.1 were affected, leading to potential mass data breaches.
Impact: Leads to total compromise of file transfer systems, with breach potential across banking, healthcare, and government sectors.
MOVEit MFT Breach – CLOP Ransomware Campaign
The MOVEit vulnerability exploited by CLOP ransomware exposed over 77 million records across 2,600+ organizations. Damages exceeded $12 billion, affecting entities like the U.S. Department of Energy.
Impact: Damages exceeded $12 billion, with critical institutions like the U.S. Department of Energy impacted, making this one of 2024’s most devastating breaches.
Black Basta – Windows Privilege Escalation (CVE-2024-26169)
Used by the Black Basta group, this vulnerability enabled elevation of privilege on unpatched Windows systems. Despite a patch issued in March 2024, delayed updates left many exposed.
Impact: Despite patches, slow adoption led to widespread infections, reinforcing the urgency of timely security updates.
TellYouThePass Ransomware – PHP Exploit (CVE-2024-4577)
This campaign exploited a PHP flaw in default XAMPP stacks on Windows, targeting public IPs with ransomware. Victims were hit with demands of 0.1 BTC (~$6,000) per infection.
Impact: Victims faced ransom demands of 0.1 BTC (~$6,000), with small-to-midsize enterprises most vulnerable due to default configurations.
Don’t wait for the next breach, see how affordable real security can be. View Pricing
Most Vulnerable Industries in 2026
| Industry | No of Vulnerabilities | % of Total |
|---|---|---|
| Software Development | 6,432 | 22.4% |
| Networking & Telecommunications | 4,876 | 17.0% |
| Consumer Electronics | 3,201 | 11.1% |
| Healthcare | 2,894 | 10.1% |
| Industrial Control Systems (ICS) | 2,108 | 7.3% |
| Finance | 1,987 | 6.9% |
| Government | 1,652 | 5.8% |
| Automotive | 1,432 | 5.0% |
| Education | 1,243 | 4.3% |
| Retail & E-commerce | 1,119 | 3.9% |
- Software development remains the most vulnerable sector, driven by the rapid release cycles of open-source libraries and cloud-native tools.
- Healthcare saw a 14.6% increase in vulnerabilities compared to 2024, raising concerns about patient safety and medical device security.
Top Vulnerable OSS Libraries
Supply chain attacks targeting OSS components increased by 22% in 2025, including notable incidents involving malicious npm packages and compromised PyPI modules.
| Library | No of Vulnerabilities | Critical Index |
|---|---|---|
| OpenSSL | 214 | High |
| jQuery | 189 | Medium |
| Apache Struts | 178 | High |
| FFmpeg | 167 | Medium |
| Linux Kernel | 156 | High |
| TensorFlow | 143 | Medium |
| WordPress Plugins | 139 | Medium |
| Python Packages (PyPI) | 132 | Medium |
| Node.js Modules | 128 | Medium |
| Android SDK | 121 | High |
Top Countries Producing Vulnerable Code
| Country | No of Vulnerabilities | % of Total |
|---|---|---|
| United States | 9,321 | 32.4% |
| China | 4,209 | 14.6% |
| Germany | 2,104 | 7.3% |
| India | 1,987 | 6.9% |
| Japan | 1,762 | 6.1% |
| South Korea | 1,432 | 5.0% |
| Canada | 1,223 | 4.3% |
| United Kingdom | 1,112 | 3.9% |
| Russia | 987 | 3.4% |
| Others | 1,796 | 6.1% |
Important Cyber Security Vulnerabilities Statistics 2026
In the Verizon Data Breach Investigations Report (DBIR), vulnerability exploitation was identified as the initial point of entry in 14% of all breaches, marking a significant increase from previous years.
Application breaches, often involving stolen credentials and vulnerabilities, accounted for 25% of all breaches in 2024, based on multiple sources.
Here is an overview based on available data.
- As of 31st May 2024, approximately 6% of all published CVEs had been exploited in the wild.
- The average CVSS score for CISA KEV (Known Exploited Vulnerabilities) listed vulnerabilities, was 8.4.
- 53% of scored CVEs discovered in 2024 were of High and Critical Severity.
The National Vulnerability Database (NVD) and the Common Vulnerabilities and Exposures (CVE) system have documented over 176,000 vulnerabilities to date—ranging from high-profile threats like CVE-2017-0144, a critical Windows SMB flaw, to widespread attacks such as the Mirai botnet, which exploited insecure IoT devices.
CVE-2026-1603 in Ivanti Endpoint Manager is an authentication bypass vulnerability that allows a remote unauthenticated attacker to access specific stored credential data through an alternate access path.
CVE-2025-26399 is a deserialization of untrusted data vulnerability in SolarWinds Web Help Desk’s AjaxProxy component that could allow an attacker to execute commands on the host machine.
From January to mid-July, the number of reported CVEs rose by approximately 30%, increasing from 17,114 in 2023 to 22,254 in 2024.
So far in 2024, 0.91% of all reported vulnerabilities (around 204 CVEs) have been confirmed as weaponized. This means they are actively exploitable in the wild.
Primary Exploitation Vectors:
The most common attack methods for weaponized CVEs include:
- Exploiting public-facing applications for initial access
- Leveraging remote services for lateral movement across networks
Revival of Older Threats:
- Research shows a 10% increase in the weaponization of older CVEs (discovered before 2024).
Vulnerability Remediation & Notable CVE Highlights
Mean Time to Remediation (MTTR) Trends
- According to Edgescan, the average time to remediate internet-facing vulnerabilities is approximately 57.5 days, a slight improvement from the previous year’s 60.3 days.
- The MTTR varies significantly by industry:
- Public sector organizations: 92 days
- Healthcare sector: 44 days
- Notably, smaller organizations tend to resolve vulnerabilities faster than larger ones, likely due to fewer systems and leaner infrastructures.
Most Severe Vulnerability of 2026: CVE-2026-21509 (Microsoft Office)
CVE-2026-21509 affects Microsoft Office and Microsoft 365, where improper reliance on untrusted inputs in security decisions allows attackers to bypass built-in OLE security protections. This vulnerability has been actively exploited by the Russian state-sponsored threat group APT28.
The flaw enables attackers to bypass Office security mechanisms and deploy malicious payloads such as backdoors or email-collection implants through crafted files. Microsoft released an out-of-band security update in January 2026 to address the issue, but unpatched environments remain vulnerable, posing ongoing risks to organizations relying on Microsoft Office for business communications and document workflows.
CVE-2026-23760 (SmarterTools SmarterMail)
CVE-2026-23760 affects SmarterTools SmarterMail, allowing unauthenticated attackers to reset administrator passwords without credentials. Listed in CISA’s Known Exploited Vulnerabilities (KEV) catalog, the flaw can enable full administrative takeover and potential command injection. Systems running SmarterMail versions prior to build 9511 remain vulnerable until patched.
Most Severe Vulnerability of 2021: CVE-2021-44228 (Log4Shell)
- Log4Shell impacted the Log4j logging library—widely used in Java-based applications and platforms.
- This critical vulnerability allowed attackers to execute arbitrary code on affected systems remotely.
- Despite prompt patching efforts, it’s believed that many unpatched instances still exist, making it a persistent threat across industries.
Oldest Vulnerability Still Discovered: CVE-1999-0517
- Originally identified in 1999, this vulnerability affects SNMPv2 (Simple Network Management Protocol v2).
- It allows unauthorized access via a guessed community string.
- With a CVSS score of 7.5, it’s categorized as a high-severity vulnerability and demonstrates how long-standing flaws can linger in legacy systems.
Critical Cloud Vulnerability Highlight of 2026: Azure Service Vulnerabilities
In 2026, security researchers identified several high-impact vulnerabilities affecting Microsoft Azure services and cloud integrations.
Some of these flaws received CVSS scores approaching 10.0, qualifying them as critical cloud security risks.
The vulnerabilities highlighted how misconfigurations, identity flaws, or service-level weaknesses in cloud environments could expose sensitive data or allow unauthorized access across cloud workloads.
Remote Access Vulnerability Attacks Continue to Rise in 2026
According to multiple threat intelligence reports, attacks targeting remote access infrastructure and edge devices continue to increase as organizations rely heavily on remote connectivity and cloud access.
- Exploitation of VPN and remote access vulnerabilities increased by over 40% year-over-year.
- Attacks targeting network appliances and edge devices (including VPN gateways and firewalls) rose by nearly 30%.
- RDP-related intrusion attempts continue to grow, accounting for a major share of brute-force and credential-based attacks.
Insight: The expansion of hybrid work environments and internet-facing infrastructure has significantly widened the attack surface, making remote access technologies a consistent target for threat actors.
Around 33% of Organizations Detected Exploitation Attempts in Recent Years
Security reports indicate that about one-third of organizations continue to detect attempts to exploit known software vulnerabilities, highlighting the persistent risk posed by unpatched systems.
- Many of these attempts target older, well-documented vulnerabilities in widely deployed software and network services.
- Legacy flaws—such as vulnerabilities in outdated protocols, remote services, and unpatched operating systems—remain frequent attack vectors for ransomware groups and opportunistic threat actors.
84% of Companies Expose High-Risk Vulnerabilities on External Networks
Another Positive Technologies study revealed that 84% of organizations had high-risk vulnerabilities on their network perimeters.
- Shockingly, over half of these vulnerabilities could be resolved simply by applying available security updates.
This highlights a widespread lack of basic patch management, especially in internet-facing assets.
26% of Companies Still Vulnerable to WannaCry
According to Positive Technologies, over one in four organizations (26%) have yet to patch the vulnerability exploited by the WannaCry ransomware—even years after its peak.
Notably, WannaCry attacks spiked again in Q1 2021, underscoring how legacy threats remain a major security concern.
Your apps may already be exposed. Talk to our security experts now. Contact Us to Start
XSS Continues to Dominate Vulnerability Reports
Research from HackerOne revealed that Cross-Site Scripting (XSS) was the most commonly reported vulnerability, accounting for 23% of all submissions.
- Other leading weaknesses included:
- Information Disclosure – 18%
- Improper Access Control – 10%
XSS persists as a top vector for injection attacks, particularly in web and SaaS environments.
Computer Software Tops Bug Bounty Earnings
When it comes to bug bounty payouts, the computer software industry offers the highest rewards for ethical hackers.
- Average payout for critical vulnerabilities:
- Computer Software: $5,754
- Electronics & Semiconductors: $4,633
- Cryptocurrency & Blockchain: $4,481
These figures highlight where researchers focus their efforts—and where organizations should prioritize defenses.
Vulnerability Volume in 2026
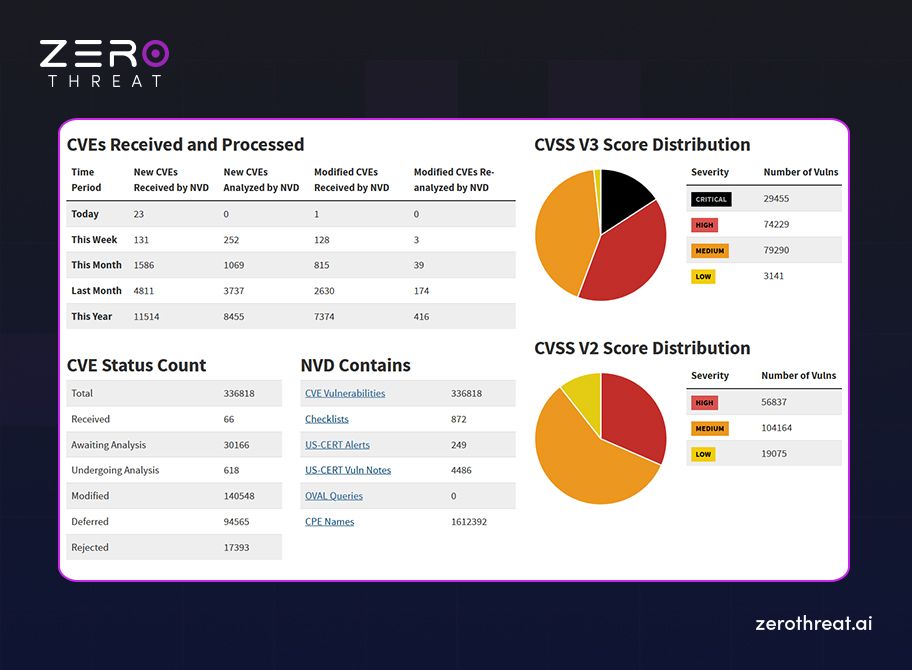
- The National Vulnerability Database (NVD) recorded 336,818 total entries.
Exploit-to-CVE Lag is a Major Concern
- Alarmingly, 80% of exploits are published before their associated CVEs are officially released.
- On average, there's a 23-day gap between exploit publication and CVE disclosure—leaving a critical window for attackers to act before defenders are alerted.
Legacy Vulnerabilities Still Being Exploited
- In 2021, 18% of attacks targeted vulnerabilities originally listed in 2013 or earlier.
- Even more concerning: 75% of attacks were carried out using vulnerabilities that had been exposed in or before 2017.
This emphasizes the urgent need for organizations to manage and remediate long-known issues—not just the latest threats.
Widespread Presence of High-Risk Vulnerabilities
- A study revealed that 84% of companies have high-risk vulnerabilities in their environments.
- Half of these could be mitigated simply by applying available software updates.
Unpatched Systems Lead to Breaches
- A staggering 60% of data breaches are caused by the failure to apply known patches—a preventable issue that remains one of cybersecurity’s biggest weaknesses.
Exponential Growth in Vulnerabilities
- 48,000+ CVEs per year
Recent vulnerability data shows that over 48,000 new CVEs were published in 2025, reflecting a significant increase in disclosed software vulnerabilities. - Daily disclosure rate ~132 CVE/day
With the rising number of disclosures, the average daily vulnerability disclosure rate now exceeds 130 CVEs per day, continuing an upward trend as software ecosystems expand. - 290,000+ vulnerabilities indexed
By early 2026, the global CVE database has surpassed 290,000 recorded vulnerabilities, highlighting the accelerating pace of vulnerability discovery.
Sectors, Platforms & Attack Vectors
- Microsoft Office—most exploited target
Between Nov 2021 and Oct 2023, >70% of cyberattacks targeted Microsoft Office; browsers (12%) and Android (6%) were also frequent targets. - Web app vulnerabilities rampant
98% of web applications are vulnerable to some kind of attack. - Unpatched vulnerabilities drive breaches
84% of companies harbor critical vulnerabilities, half of which could be mitigated with simple patches, and failure to apply patches causes ~60% of breaches.
Exploitation Velocity & Scale
- Fastest breakouts ever recorded (51 sec) CrowdStrike reports a record-breaking ~51-second eCrime breakout time.
- AI-driven scanning: 36,000 scans/sec globally\ Fortinet data reveals a 16.7% increase year-over-year in automated scans, now exceeding 36k per second.
- Malware-free threats rising\ CrowdStrike logs show 79% of detections in 2024 were malware-free.
Economic Stakes
- Cybercrime cost → $10.5 trillion
Projected global cost of cybercrime reaches US$10.5 trillion in 2025, with a projected $23 trillion by 2027. - Average data breach cost ~US$4.88 million
In 2024, the average cost per data breach hit US$4.88 million, marking a 10% YoY increase. - Healthcare sector hit hardest
Ransomware grew by 264% over 5 years; average healthcare breach cost: US$10.1 million.
National & Regional Insights
- India: only 7% of organizations cyber-ready
Cisco's 2025 index shows just 7% of Indian orgs are equipped to handle modern (AI-augmented) cyber threats. - EU launches own vulnerability database
After seeing some 40,000 annual CVE submissions to U.S. systems—with 100+ daily reports and 1 critical each day—the EU enacts its own database to reduce dependency.
Detection and Severity of Vulnerabilities
- A 2020 World Economic Forum report revealed a shockingly low vulnerability detection rate of just 0.05% in the U.S., signaling a significant gap in proactive threat identification.
- 43% of cyberattacks target small businesses, yet only 14% are adequately prepared to defend against them, exposing a serious readiness gap in the SME sector.
- Organizations with fewer than 100 employees tend to have the lowest number of critical or high-severity vulnerabilities, likely due to smaller and simpler IT environments.
- In contrast, enterprises with over 10,000 employees face the highest volume of critical vulnerabilities, reflecting the complexity and scale of their infrastructure.
- On average, 4.6% of vulnerabilities in web applications are classified as critical, while 4.4% are high severity—indicating a consistent, measurable risk in web-facing systems.
- For applications that process payment card data, the share of critical vulnerabilities rises to 8%, highlighting the heightened risk in financial transaction environments.
- Over 33% of discovered vulnerabilities across the full technology stack were categorized as critical or high severity, underlining persistent risks from top to bottom—application to infrastructure.
- SQL Injection (CWE-89) continues to be the most prevalent critical web application vulnerability, maintaining its top position since 2022.
- Application/API: high/critical severity: average MTTR 74.3 days.
- Device/network vulnerabilities: high/critical severity: average MTTR 54.8 days.
- A total of 40,009 CVEs were published in 2024—a record high and a reflection of the growing complexity in software and hardware ecosystems.
- The CISA Known Exploited Vulnerabilities (KEV) catalog contained 1,238 vulnerabilities by the end of 2024, with 185 added during the year
- 768 CVEs were publicly reported as exploited for the first time in the wild in 2024, representing 2% of all discovered vulnerabilities and a 20% increase from 2023.
- A Veracode study found that 80% of organizations fail to address newly discovered flaws within the first 18 months after an initial scan.
- Over time, vulnerabilities become more persistent—especially in older software, where fixes are applied less frequently, and maintenance often declines.
- Around 70% of applications still contain at least one known vulnerability even after five years in production.
- In 2022, 19% of all scanned software was found to have high or critical severity vulnerabilities, representing a major concern for organizations with aging codebases and insufficient patch management.
- Only about 30% of organizations can detect exploitable vulnerabilities within 24 hours of disclosure, leaving the majority exposed during the early exploitation window.
- Nearly 56% of vulnerabilities discovered in enterprise environments remain unremediated after 90 days, indicating persistent patch management gaps.
- Approximately 41% of organizations have at least one internet-facing asset with a critical vulnerability, significantly increasing the risk of external exploitation.
- More than 63% of exploited vulnerabilities were disclosed at least two years before exploitation, demonstrating that attackers frequently target older, well-known flaws.
- Organizations take an average of 55 days to remediate critical vulnerabilities, while medium-severity flaws often remain unresolved for over 100 days.
- Over 72% of organizations discovered high-risk vulnerabilities in open-source components within their applications, highlighting the growing security impact of third-party libraries.
- More than 60% of organizations report that vulnerability prioritization—not detection—is their biggest challenge, due to the high volume of alerts and limited remediation resources.
- Around 38% of vulnerabilities discovered in enterprise environments are classified as high or critical severity, requiring urgent remediation to prevent exploitation.
- Nearly 45% of security teams report false positives as a major barrier in vulnerability management, slowing down remediation and increasing operational workload.
- About 29% of organizations lack continuous vulnerability monitoring, relying instead on periodic scans that may miss actively exploitable threats.
Critical Application Security and Threat Exposure Stats
- 76% of all applications have at least one known vulnerability, highlighting the widespread gaps in secure software development practices.
- 1 in 5 organizations still do not test their software for security flaws, leaving systems highly exposed to preventable threats.
- 80% of public exploits are made available before the corresponding CVEs are officially released, giving attackers a dangerous head start.
- 80% of cyberattacks continue to exploit vulnerabilities that are three years old or more, showing that old flaws remain highly relevant.
- A staggering 84% of companies have high-risk vulnerabilities on their network perimeter, which could be easily leveraged for initial access.
- 69% of modern malware now targets zero-day vulnerabilities, underlining how rapidly evolving threats are outpacing traditional defense measures.
Stop guessing. Continuously find exploitable vulnerabilities with AI pentesting Test Your App for FREE
Final Thoughts: From Awareness to Action
It’s right to say that in 2026, cybersecurity is no longer about whether you’ll face a vulnerability, but how fast you can detect, assess, and respond.
In a year where 48,000+ new vulnerabilities emerge and attacks scale in seconds, the only way to stay safe is to stay ahead with automation, intelligence, and speed.
ZeroThreat was built for this reality.
By leveraging dual AI engines and an agentic AI-powered pentesting architecture, ZeroThreat autonomously discovers and validates exploitable vulnerabilities across web applications and APIs. The platform identifies security risks up to 10x faster with over 99.9% accuracy, significantly reducing false positives through automated validation.
ZeroThreat continuously tests complex authenticated workflows, integrates seamlessly into CI/CD pipelines, and delivers proof-based findings with AI-generated remediation guidance, enabling security teams to fix vulnerabilities before they reach production.
Instead of drowning in CVEs and chasing patch cycles, ZeroThreat empowers your team to focus only on what matters—critical, real threats that put your data and users at risk.
In a year where threat velocity defines survivability, ZeroThreat doesn’t just help you keep up—it keeps you ahead.
Ready to see where you stand?
- Run a Free Vulnerability Scan: https://app.zerothreat.ai/
- View Pricing: https://zerothreat.ai/pricing
- Contact Our Security Experts: https://zerothreat.ai/contact-us
Frequently Asked Questions
What is a software vulnerability?
A software vulnerability is a weakness or flaw in an application, system, or network that attackers can exploit to gain unauthorized access, steal data, or disrupt operations.
How many vulnerabilities are discovered each year?
What percentage of vulnerabilities are considered critical?
How quickly do attackers exploit new vulnerabilities?
Why do organizations struggle to fix vulnerabilities quickly?
What types of vulnerabilities are most commonly exploited?
How can organizations reduce vulnerability risks?


Explore ZeroThreat
Automate security testing, save time, and avoid the pitfalls of manual work with ZeroThreat.